Accessing Your Reports
Availability: Reports are available in Usetiful Plus and higher plans. You can start a 14-day free trial to try them out.
Location: Find your tour-specific data in the Reports section of your Usetiful dashboard.

Understanding the Reporting Dashboard
The reporting dashboard provides several key metrics and charts to help you assess tour performance:
| Metric | Definition | Insight & Actionable Tip |
| Assists Last 30 Days | The number of unique people who were supported by the tour over the last 30 days. | This counts each user only once within an hour, regardless of how many times they were assisted or how many steps they opened on a given day. |
| Tours Started | The total number of tours actively started by users (meaning the second step was reached). | If this value is low: The first step is not engaging. Action: Improve the initial text content and the labels on the actions that prompt the next step. |
| Tours Completed | The total number of users who successfully finished the entire tour (meaning the last step was finished). | This is your completion rate, indicating successful user activation through the tour. |
Key Charts for Analysis
Performance Overview Trend: Shows a historical trend of Assists, Tour Starts, and Tour Completes, allowing you to track performance changes over time.
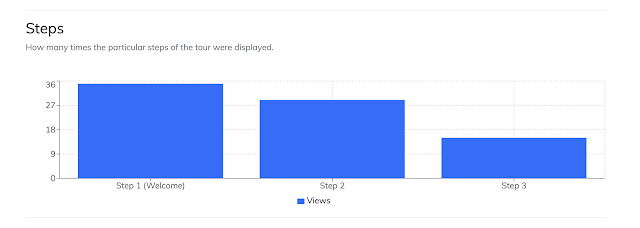
Steps Chart: Displays how many times each particular step of the tour was displayed.
- Steps Breakdown and Analyzing Drop-off Points:
The default "Steps" chart on the report page also visually shows drop-offs between steps. To identify who stopped and where, you can download a detailed report.
Actionable Tip: If you notice a significant drop in views between consecutive steps, it suggests a navigation issue. Consider improving navigation by enabling progress display or changing the names of the navigation buttons.
- Steps Breakdown and Analyzing Drop-off Points:
Filtering Your Data
To analyze specific user segments or condition, use the filtering feature in your reports by clicking "Show Filter" on the report page.
Exporting and Downloading Reports
You can download user data for further analysis outside of Usetiful:
The Download CSV button in the Reports section allows you to export valuable data, including:
User Tour Steps
Form Answers
Survey Responses
Comparing All Guided Tours
For a better comparative view of all your guided product tours:
Return to the list of reports.
All important performance numbers for every tour are updated daily in the main table, providing an at-a-glance comparison.
We hope you find the tour reports useful for maximizing user engagement and activation!


