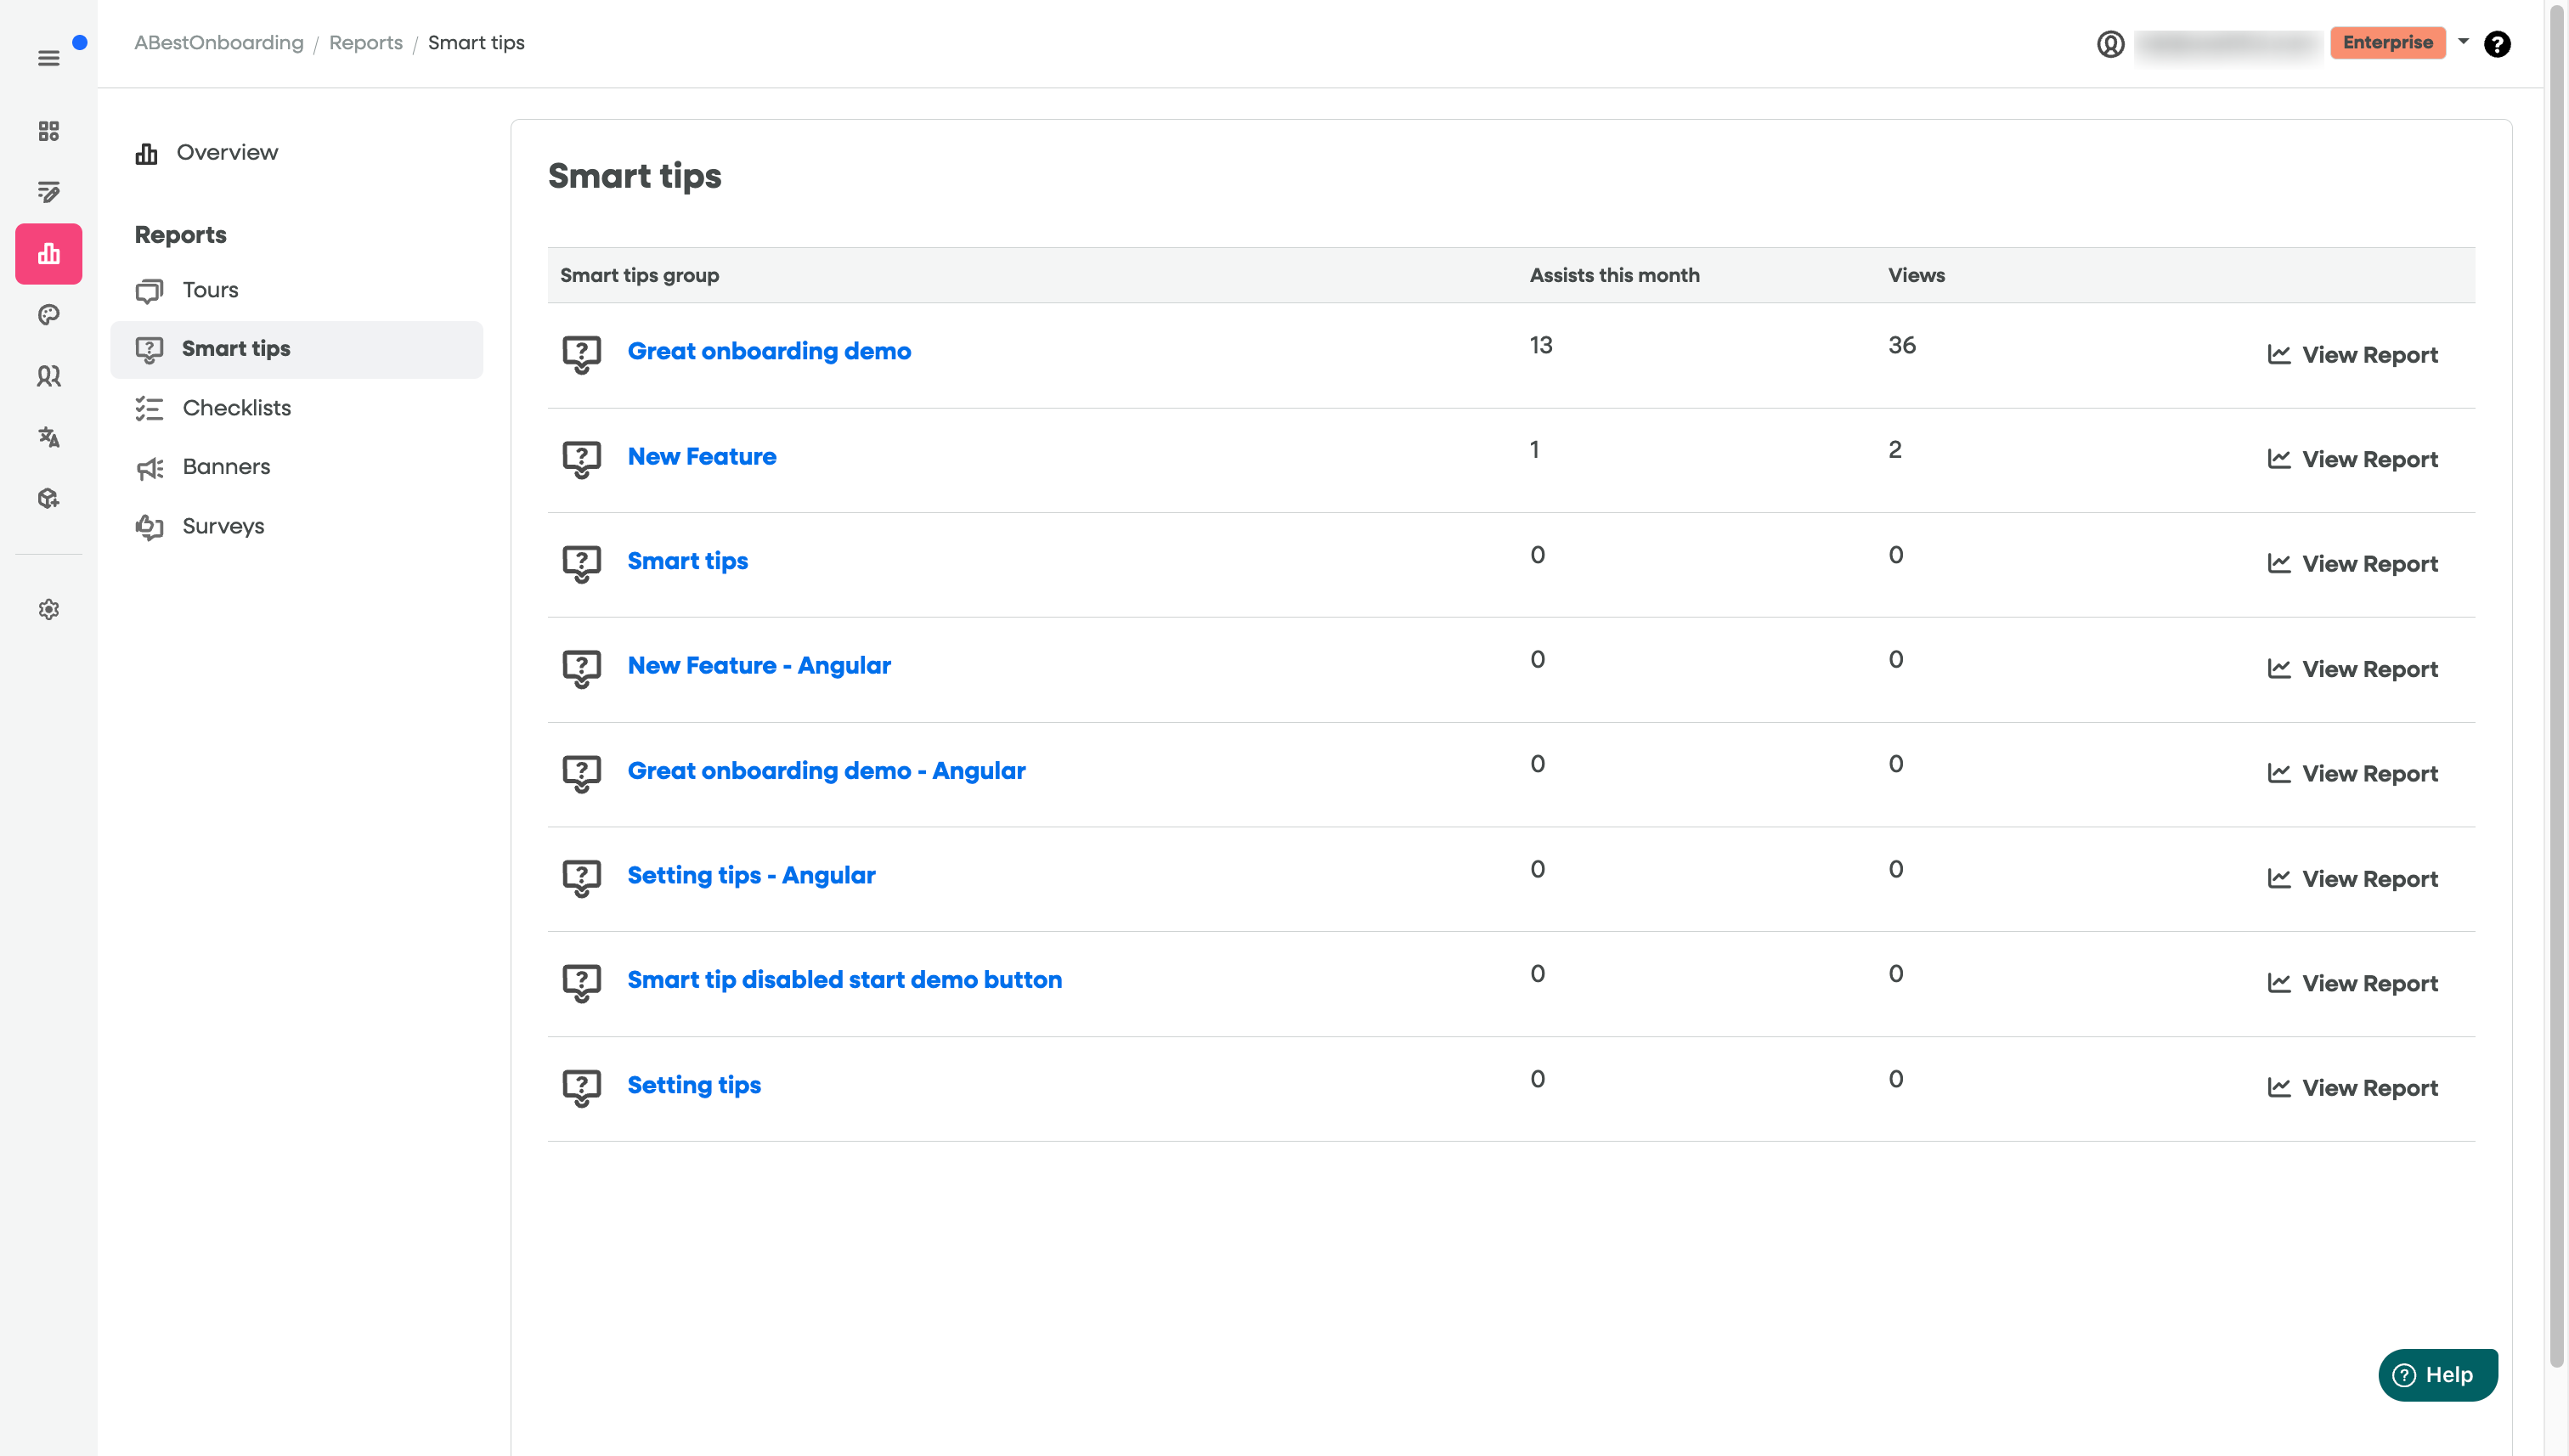
The Smart Tips Report provides a detailed analysis of the performance and visibility of your Smart Tips—short, contextual guides designed to assist users within a specific application group. Understanding these metrics helps you gauge user engagement and the effectiveness of your proactive assistance.
Report Components
1. Key Metrics Summary
| Metric | Definition | Importance |
| Assists last 30 days | The total number of times users interacted with the Smart Tip group, leading to a successful activation of the tooltip or dismissal after absorbing the information. | Measures engagement and the direct impact of the tips on user workflow. |
| Views | The total number of times a Smart Tip was displayed (rendered on the screen) to a user. | Measures the visibility and reach of your tips. |
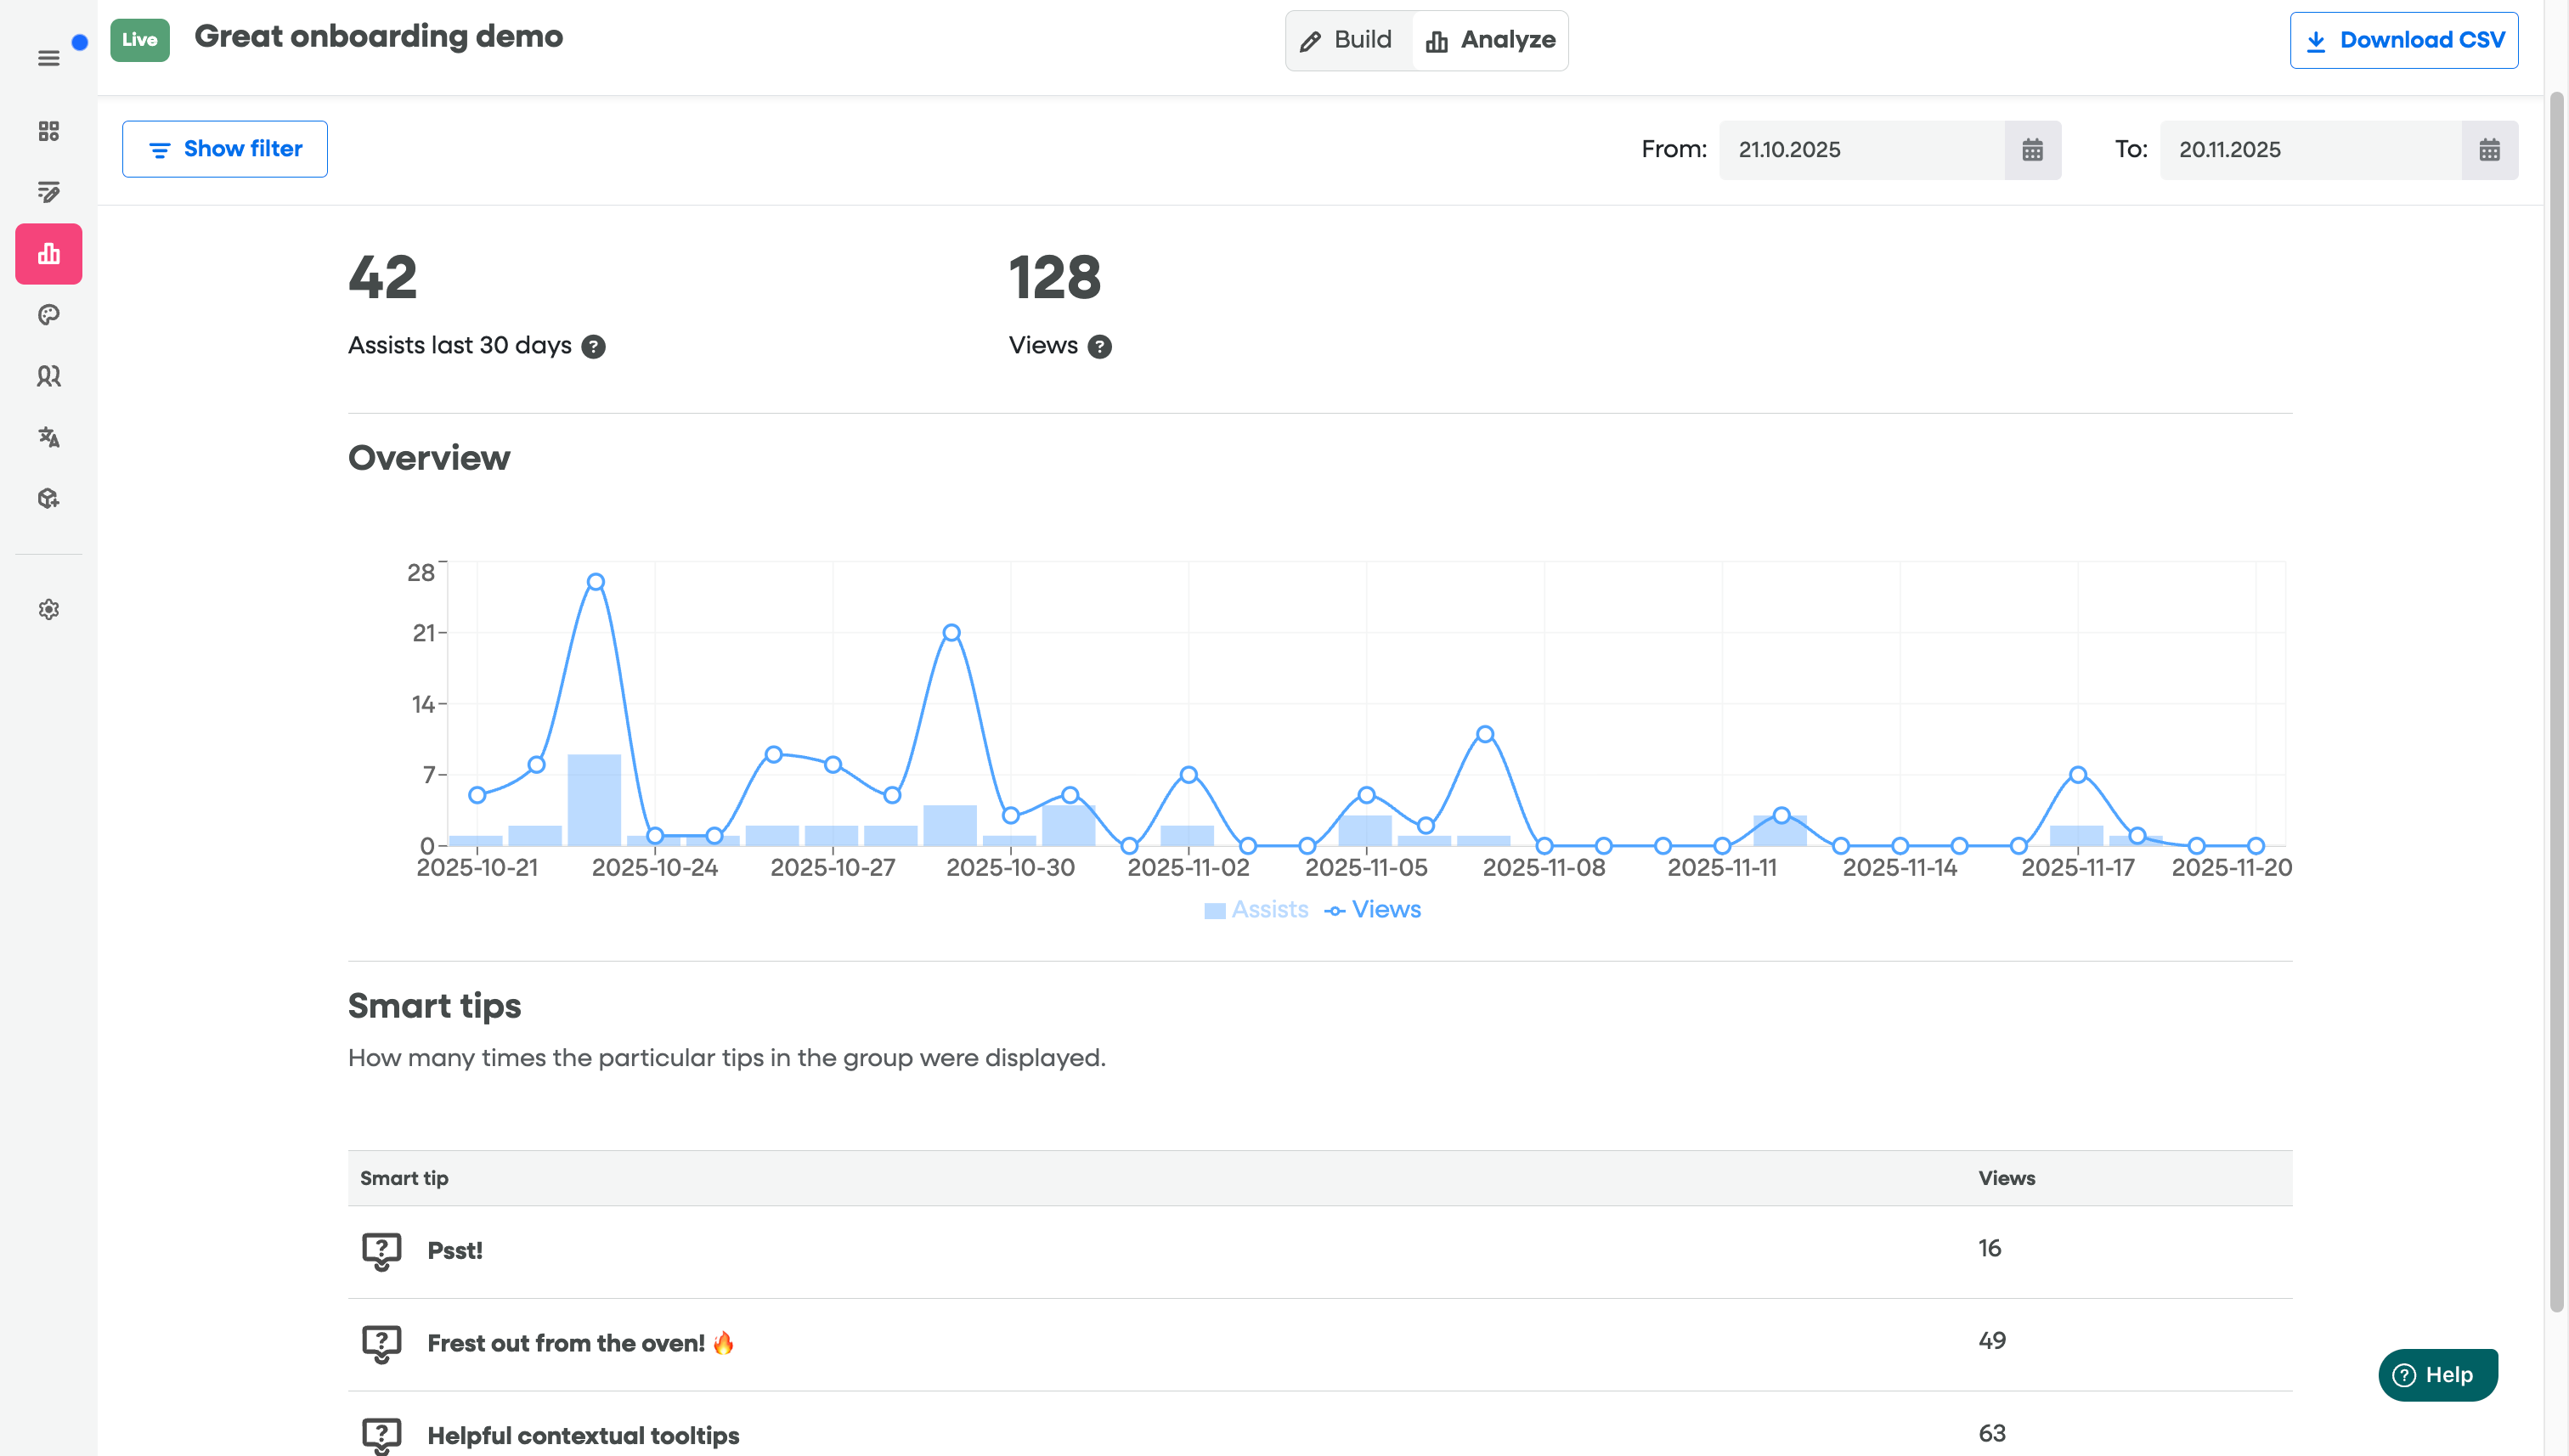
2. Overview Chart
The line graph tracks the daily trend for both Assists and Views over the selected time range (in the image, it's from 2025-10-21 to 2025-11-20).
Light Blue Bars (Assists): Shows the daily count of user interactions/successful outcomes.
Blue Line (Views): Shows the daily count of times the tips were displayed.
How to Analyze:
Compare the height of the line and the bars to see the Assist-to-View ratio. A high assist count relative to views suggests a very effective and well-targeted tip.
Look for spikes in views (line) that don't correspond to a spike in assists (bar). This might indicate the tip is appearing frequently but isn't relevant or helpful to the users seeing it.
Look for dips in both metrics, which may align with weekends, holidays, or a lack of user activity in that specific application area.
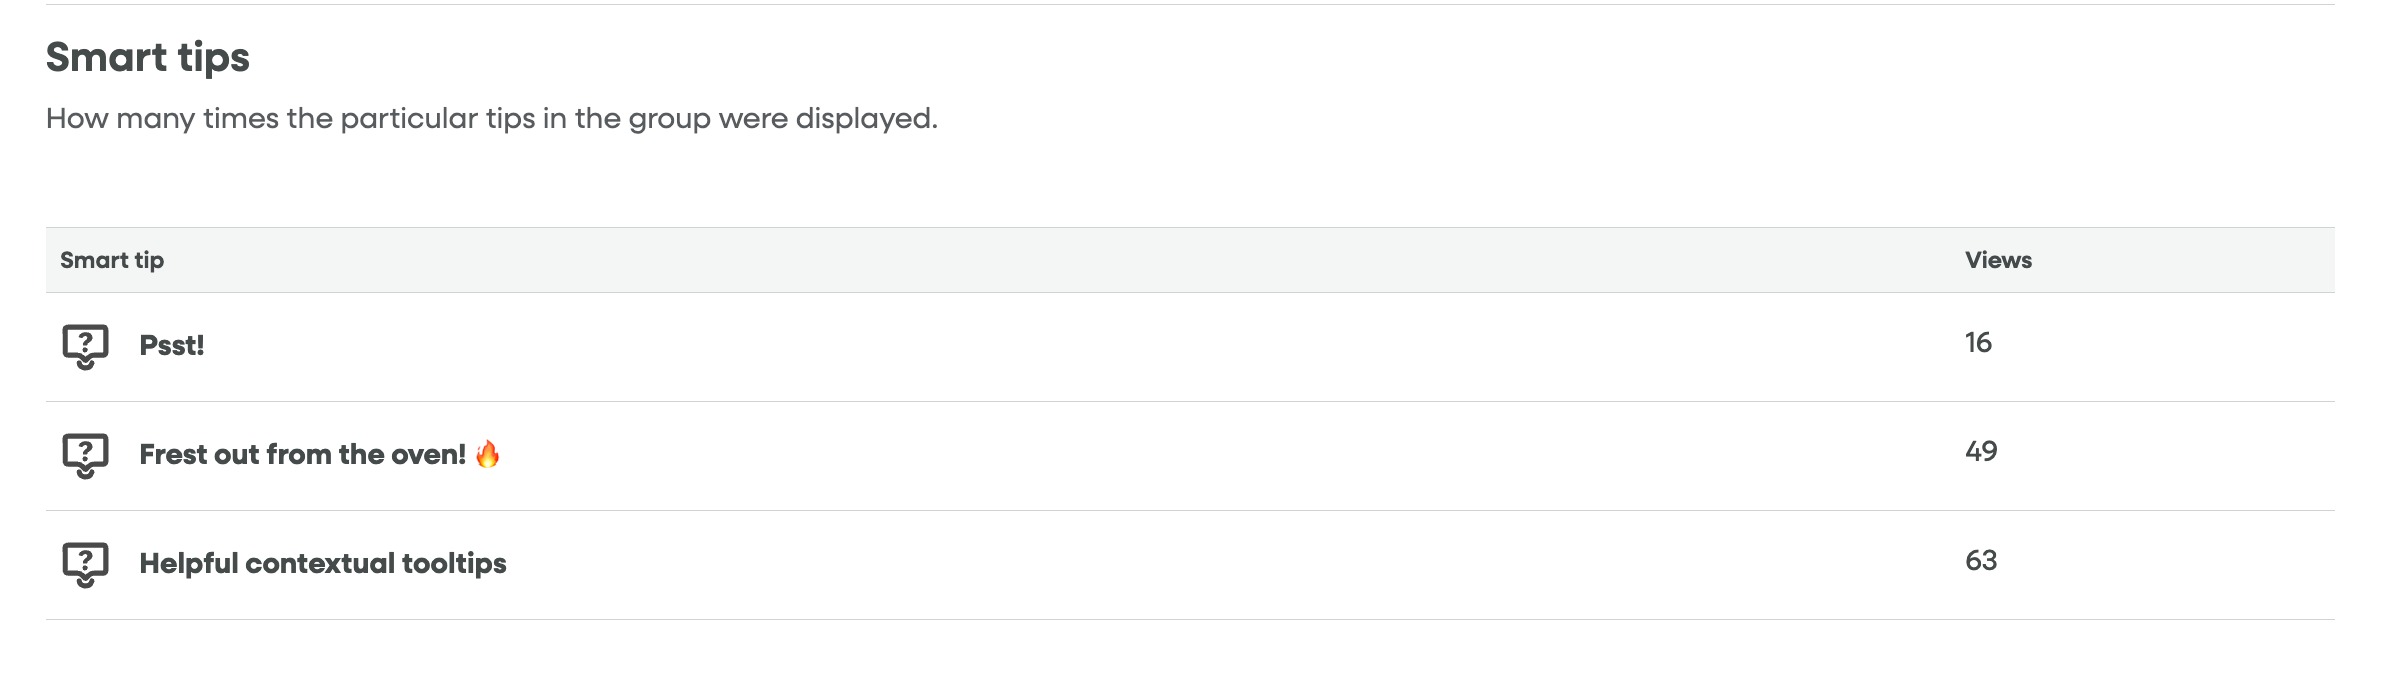
3. Smart Tips Detail Table
This table breaks down the performance for each individual Smart Tip within the group.
| Column | Description |
| Smart tip | The unique name or title given to the specific tip. |
| Views | The total number of times this particular tip was displayed over the selected time period. |
Example from the image:
How to Use This Report
Identify High-Impact Tips: Look for tips with a high Assists count (from the summary metrics) and then check the table for tips with high Views. The best performing tips should have a strong ratio of the former to the latter.
Optimize Low-Performing Tips: If a tip has a low Views count, it may need revision.
Is the copy clear?
Is the placement correct?
Is the tip truly helpful or just annoying?
Track Adoption Over Time: Use the Overview Chart to see if the visibility of your tips (Views) is growing as your user base increases or as you promote a new feature.
Filter and Export Options
Date Range: Use the date pickers (e.g., "From: 21.10.2025" to "To: 20.11.2025") to customize the time period you wish to analyze.
Show Filter: Allows you to apply additional criteria, such as filtering by user segments, devices, or specific actions by tags you've created.
Download CSV: Export the raw data from the report into a
.CSVfile for deeper analysis in external tools like Excel or Google Sheets.