The Checklist Report provides a comprehensive look at how users interact with your onboarding guides. This data helps you identify where users are finding value and where they might be dropping off, allowing you to optimize your onboarding flow for better retention.
1. High-Level Performance Metrics
At the top of your report, you'll find four primary KPIs that summarize checklist activity over your selected date range:
| Metric | Definition |
| Assists last 30 days | Total checklist items completed. Records one assist per item completion; excludes duplicates from repeated interactions. |
| Views | Total times the checklist was displayed on-screen, measuring overall reach and visibility. |
| Unique Users | The total count of individual users who viewed the checklist. |
| Completion Rate | The ratio of full checklist completions to unique displays. |
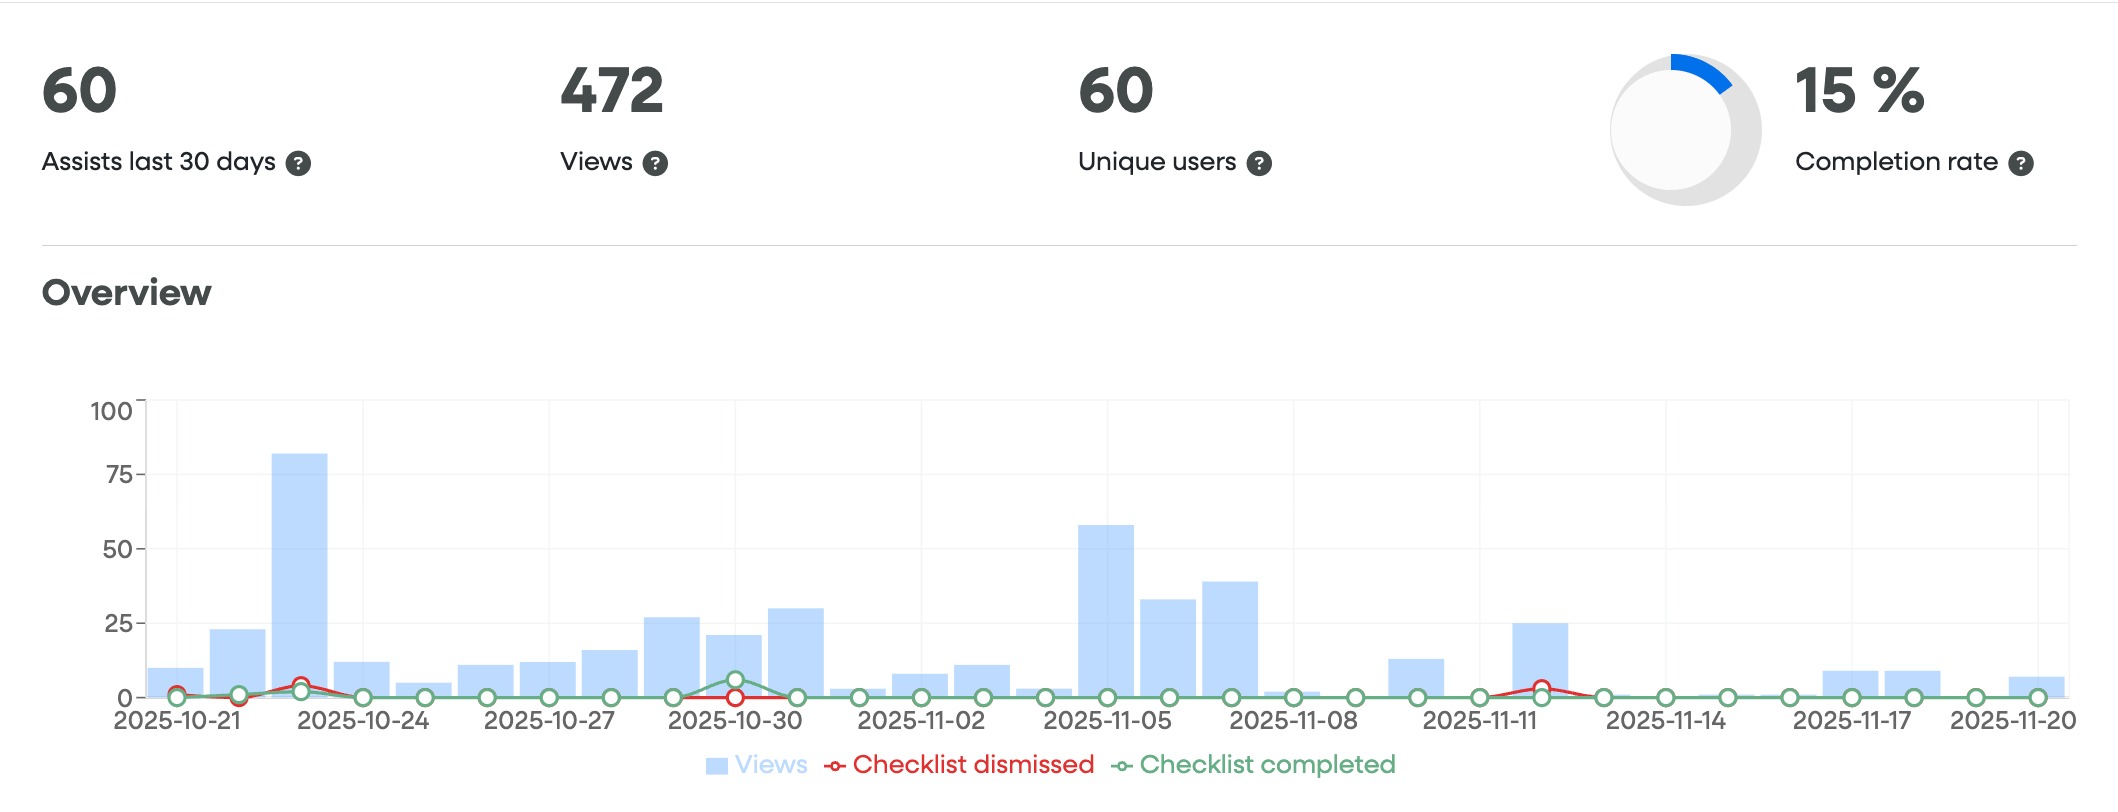
2. The Overview Chart
This graph visualizes engagement trends over time. It tracks three specific behaviors:
Views (Blue Bars): Shows daily spikes in checklist visibility.
Checklist Dismissed (Red Line): Tracks when users manually close or skip the checklist.
Checklist Completed (Green Line): Shows the frequency of users reaching the final step of the checklist.
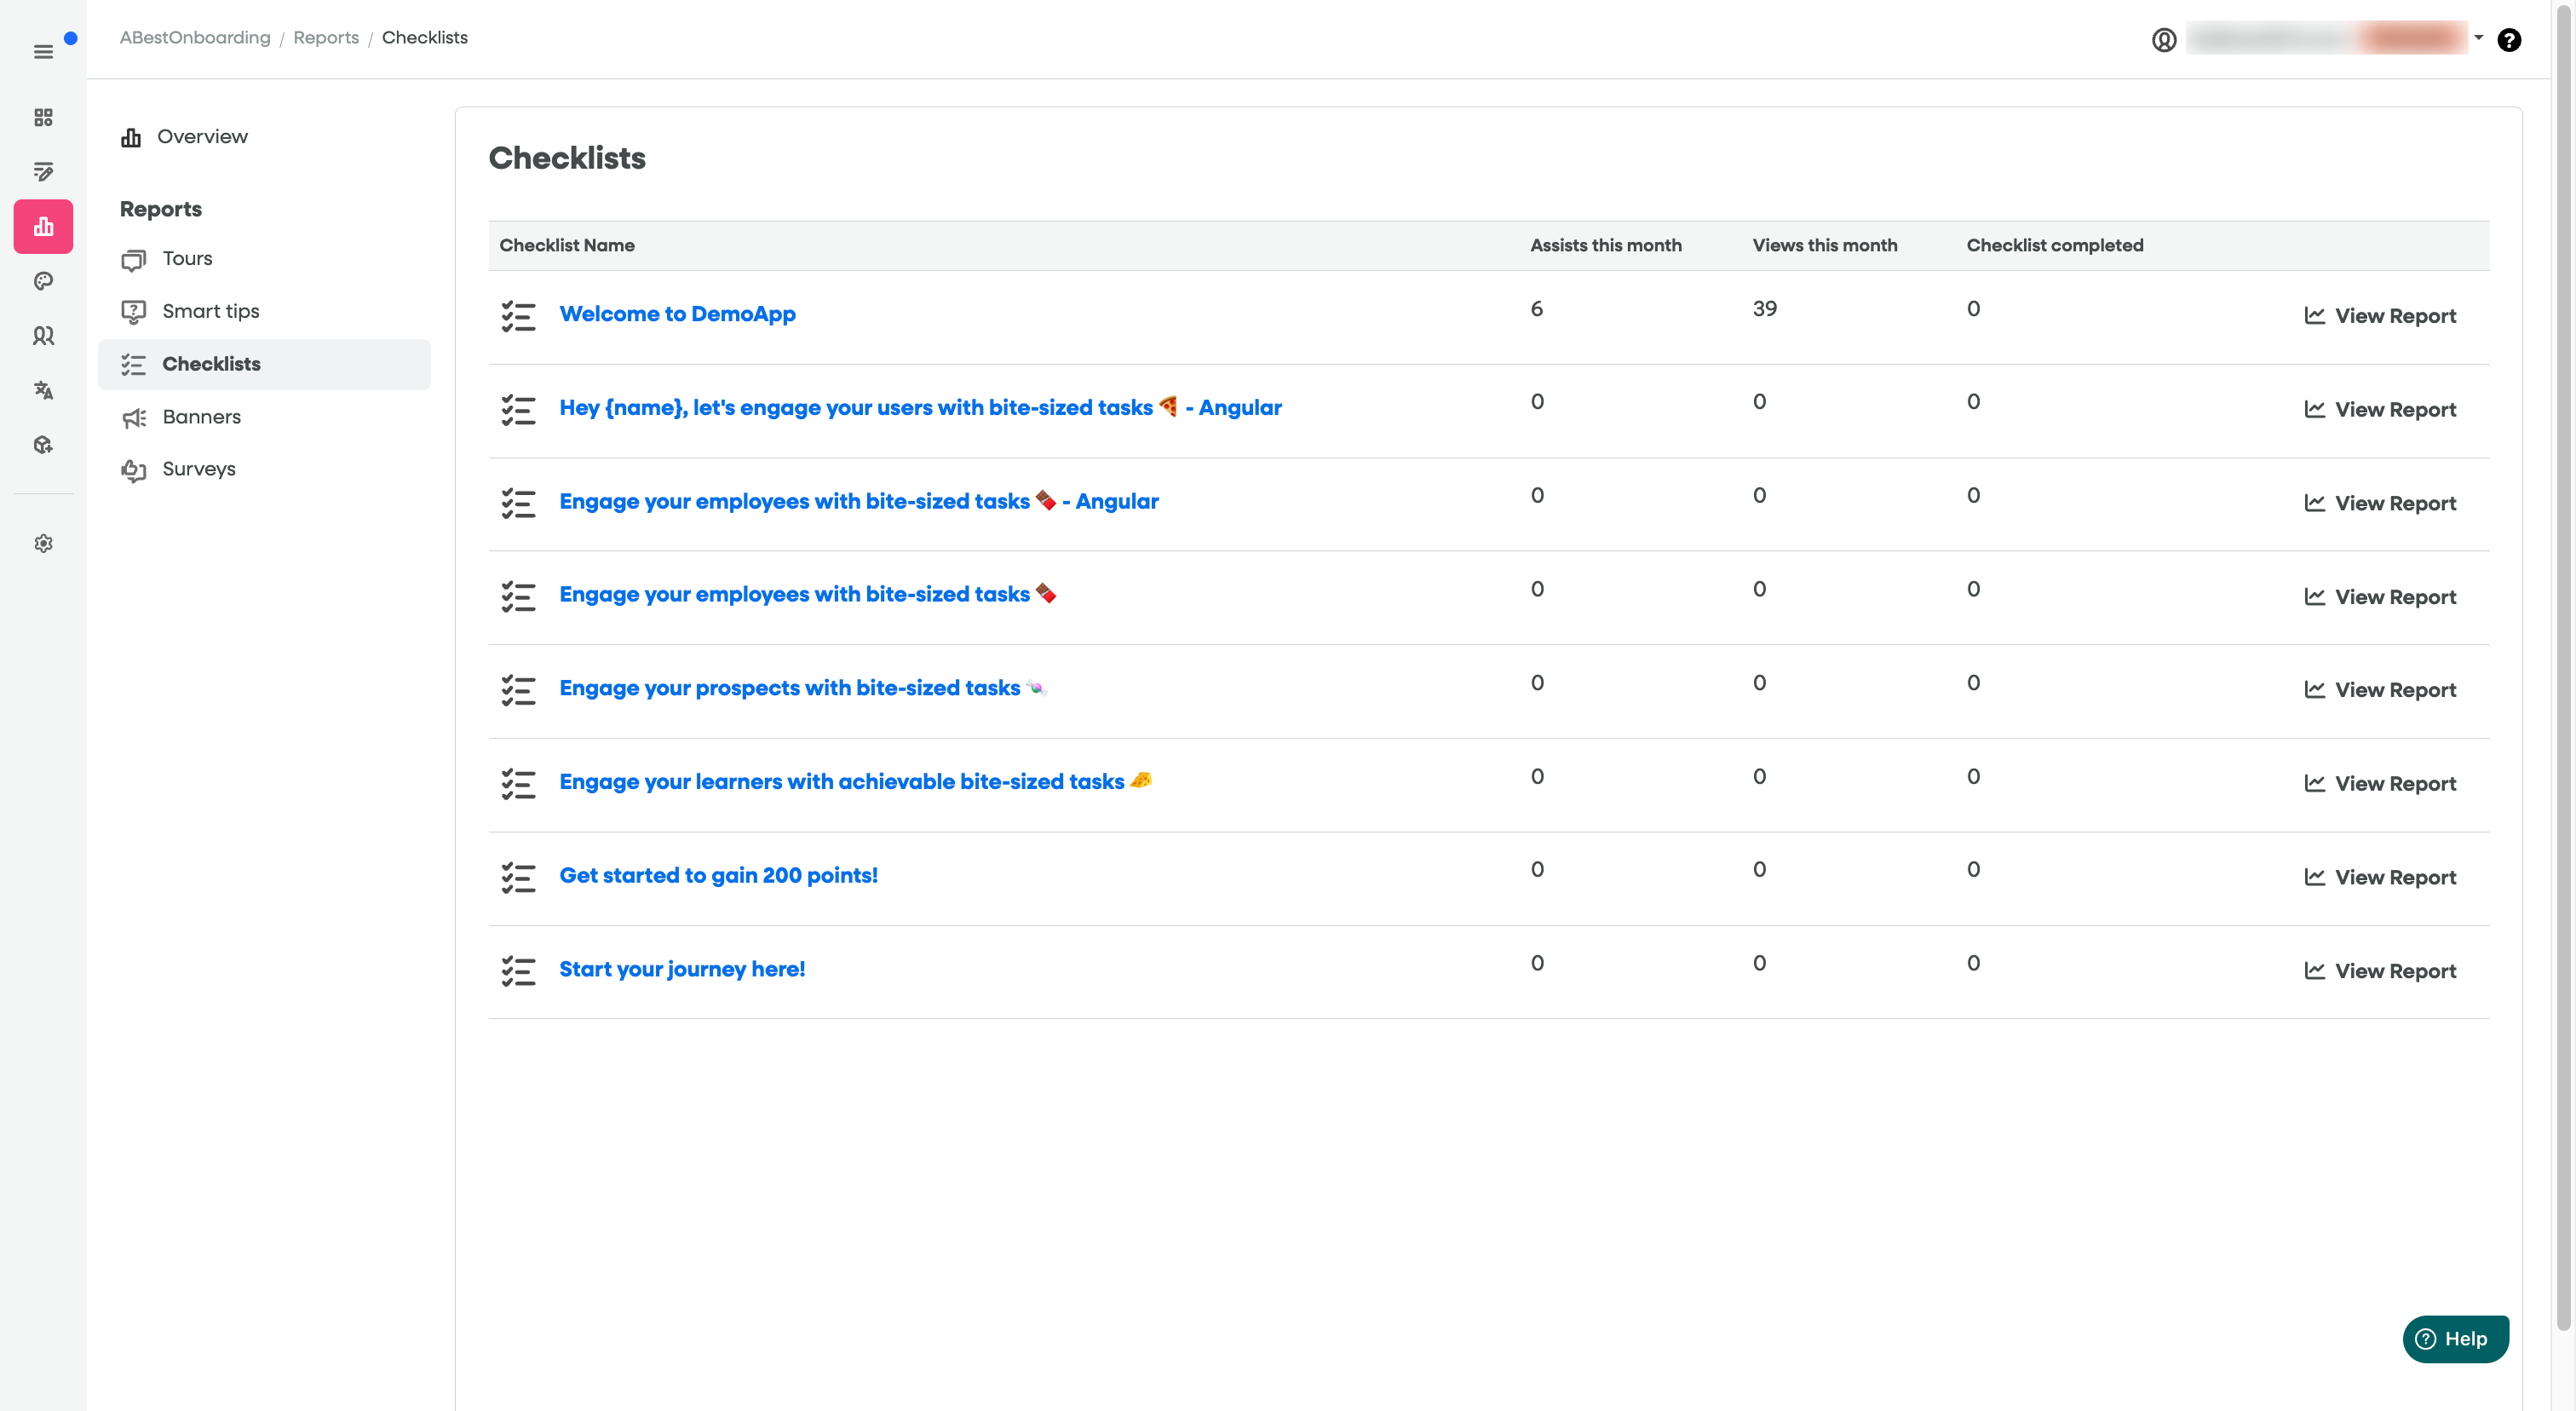
3. Items & Item-Level Analytics
This section drills down into the performance of individual items within your checklist.
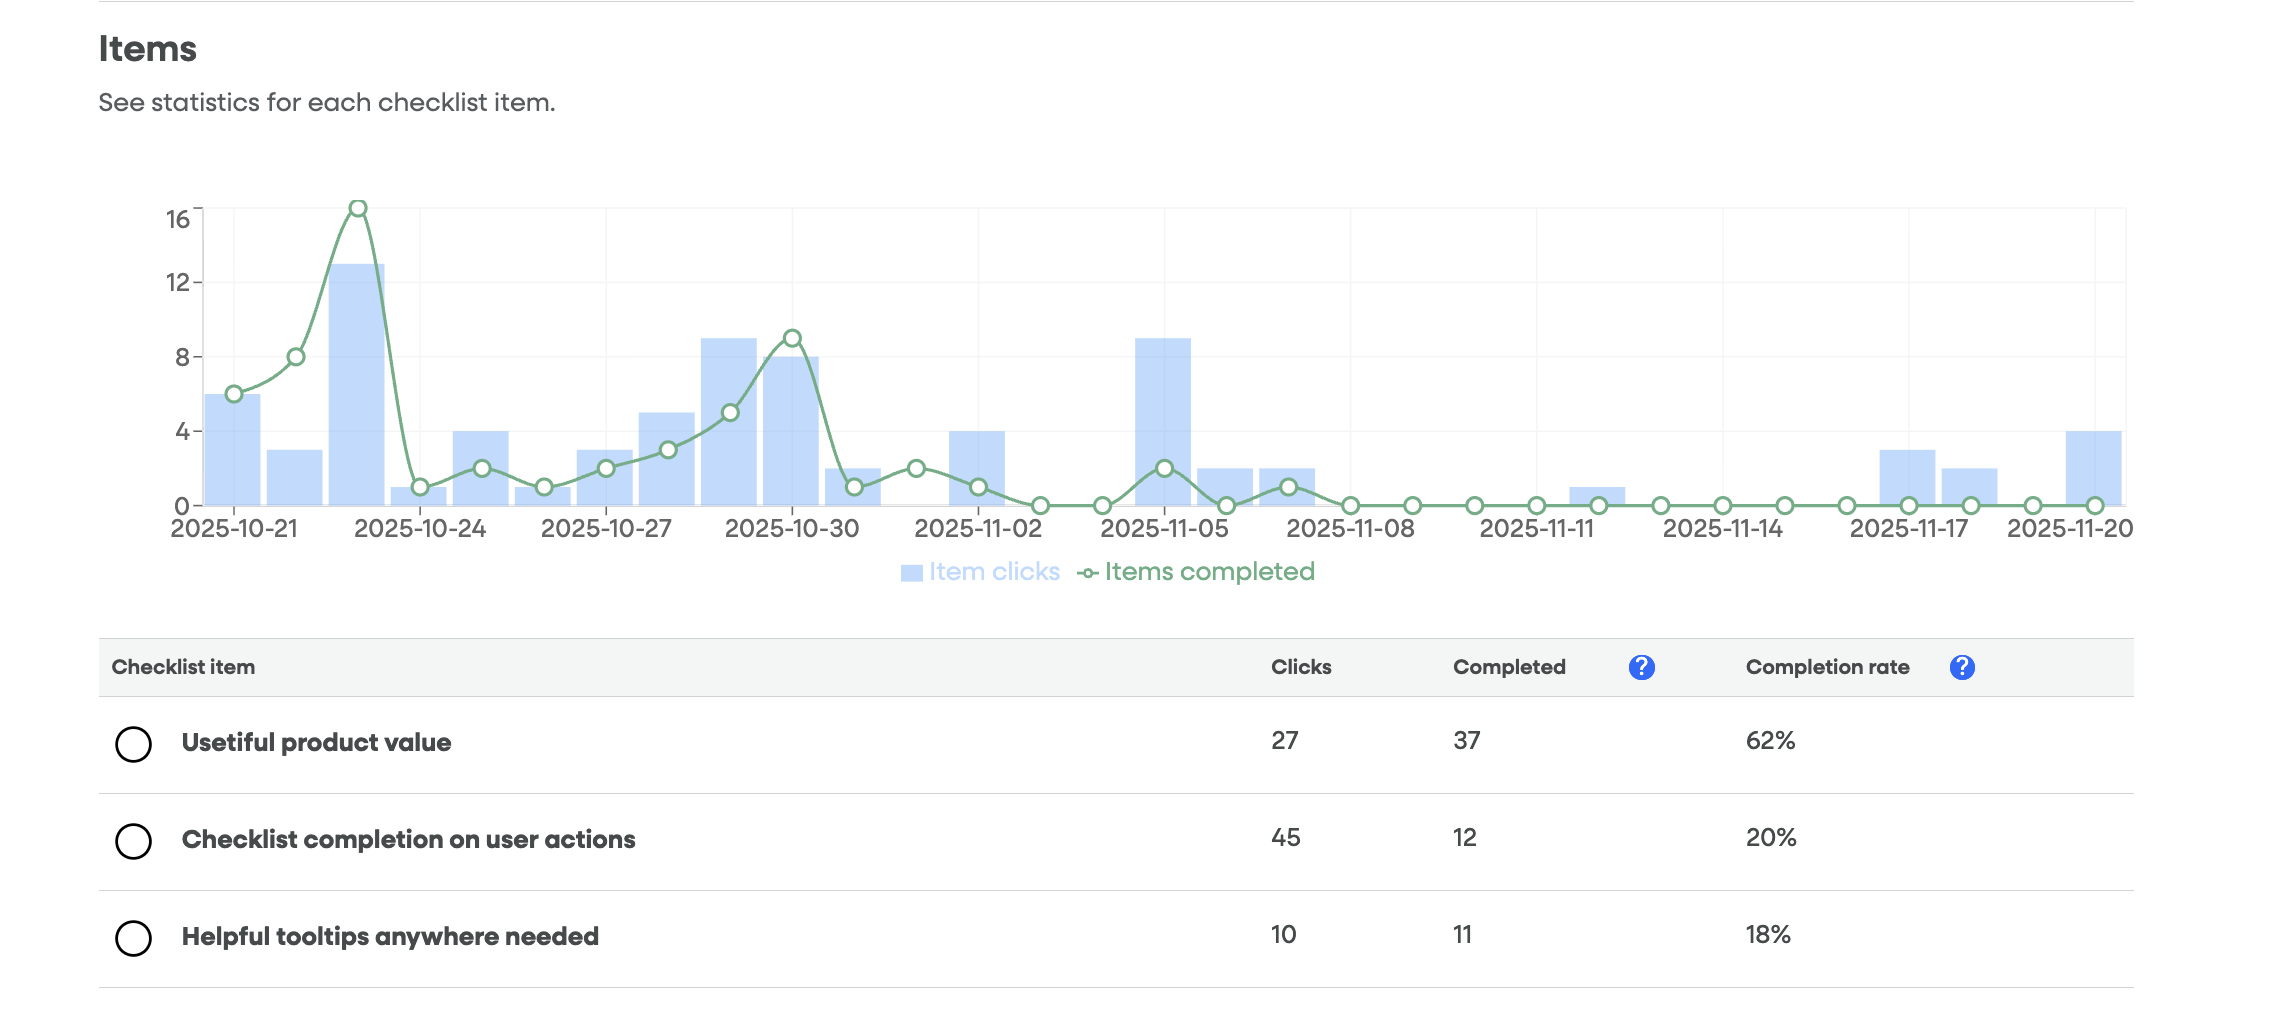
The Items Chart
This chart correlates Item Clicks (user intent) with Items Completed (user success). A large gap between clicks and completions usually points to a technical hurdle or a confusing step in that specific guide.
Detailed Item Table
| Metric | Description |
| Checklist Item | The specific name of the task or guide. |
| Clicks | How many times users clicked this specific item to start the guide. |
| Completed | The count of items that have met their completion conditions. |
| Completion Rate | The percentage of unique users who completed the item. |
4. Troubleshooting: Why is my Completion Rate low?
If you notice a high number of Views but a low Completion Rate, consider these common factors:
Checklist Length: Users may feel overwhelmed if there are too many items. Try to keep checklists to 3-5 high-value tasks.
Difficulty Gap: Look at the Detailed Item Table. Is there one specific item where "Clicks" are high but "Completed" is low? That step or flow may be too complex or broken.
Relevance: Ensure the checklist is triggered for the right user segment at the right time in their journey.
5. Filtering and Exporting Data
Date Range: Use the date pickers at the top right to analyze specific periods.
Download CSV: Click the button in the top right corner to export your raw data for custom reporting.
Show Filter: Use this to segment data by specific user groups or checklist states. Read more